
Lagrange.AI User Guide
This User Manual provides a step-by-step guide to using the Lagrange.AI platform for supply chain analytics. It covers user authentication, workspace creation and management, and model analytics, including configuration, execution, and dashboard reporting.
Leverage AI for resilient & sustainable supply chain networks. Our platform is designed to optimize supply chain management, helping organizations track, manage, and analyze their operations efficiently.
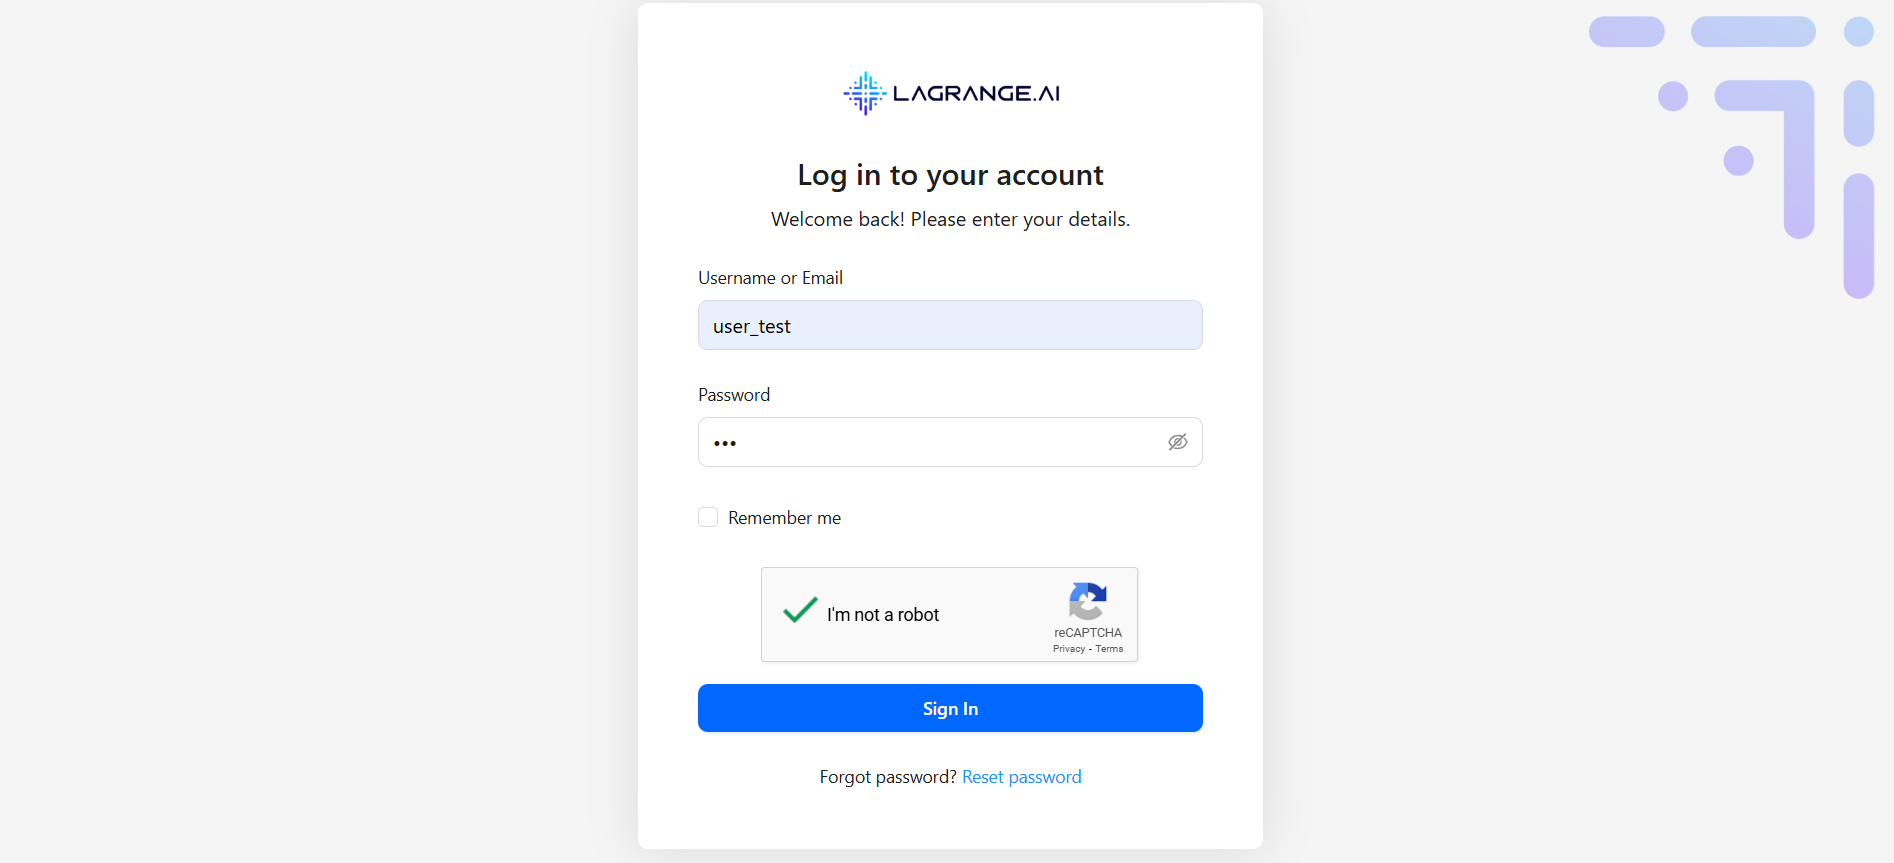
Sign-in Process
When you access the platform, you'll be directed to the Sign-In Page where you can:
- Enter your credentials (Email or Username + Password)
- Complete reCAPTCHA (security verification)
- Use 'Remember Me' option to stay logged in
- Recover your password via the 'Forgot Password?' link
Password Management
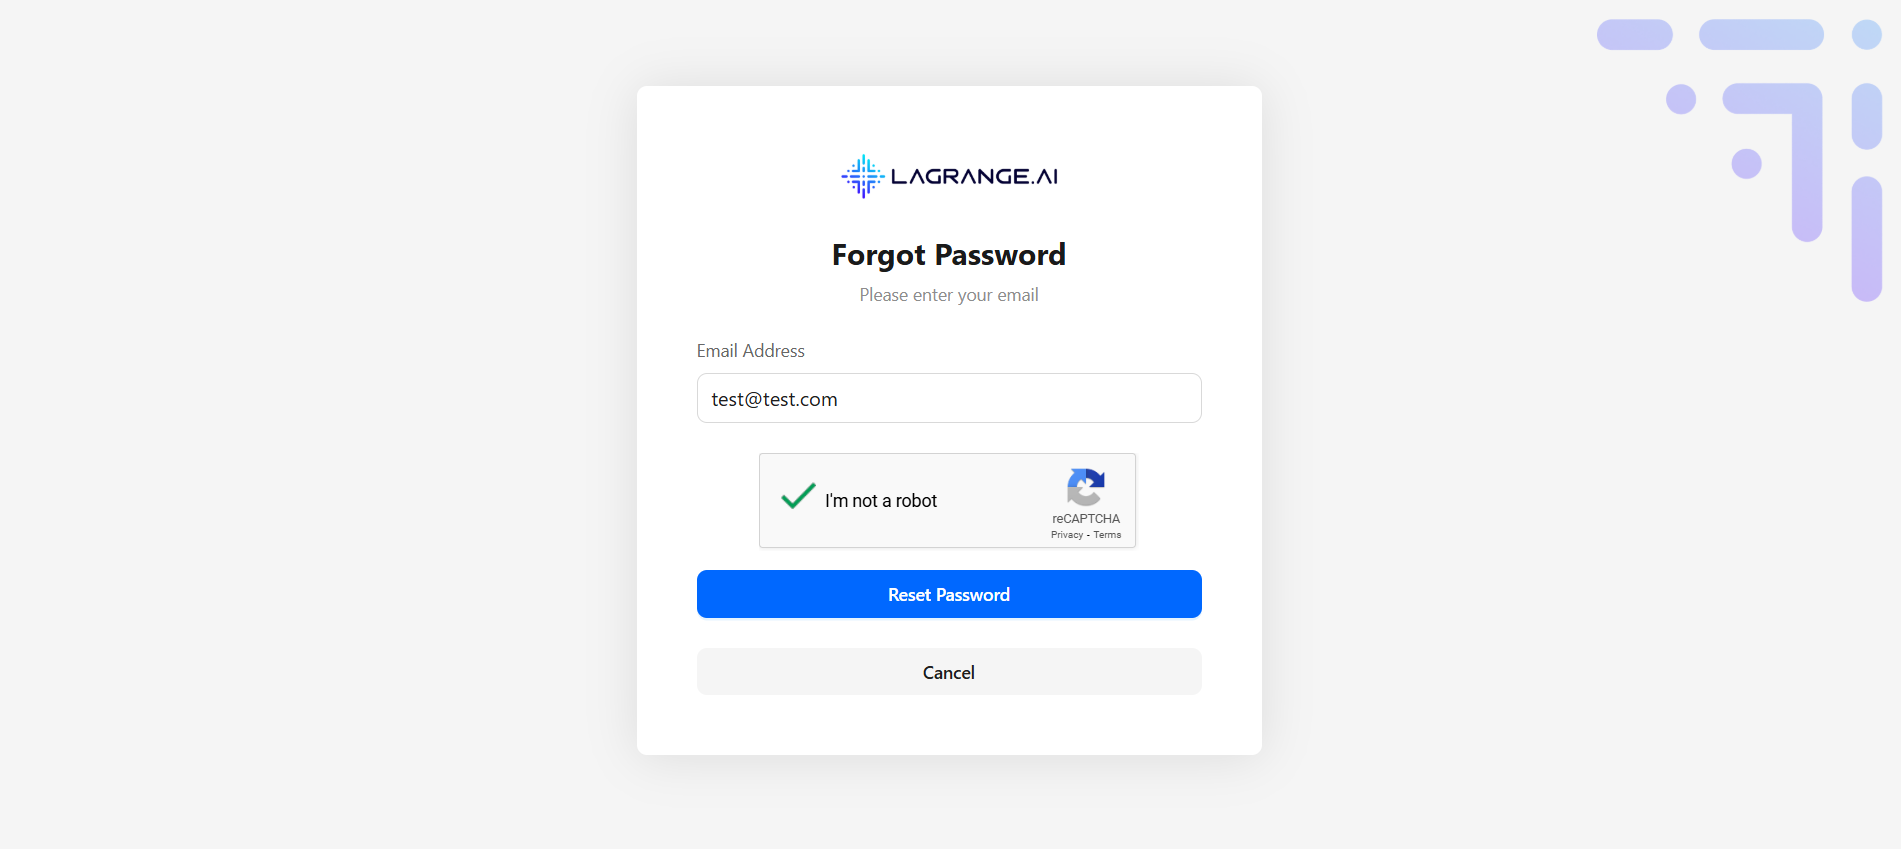
Forgot Password
- Click 'Forgot Password? Reset Password' on the sign-in page
- Enter your registered email address
- Receive a reset link via email (expires after a set time)
- Follow the link to continue
User Invitation System
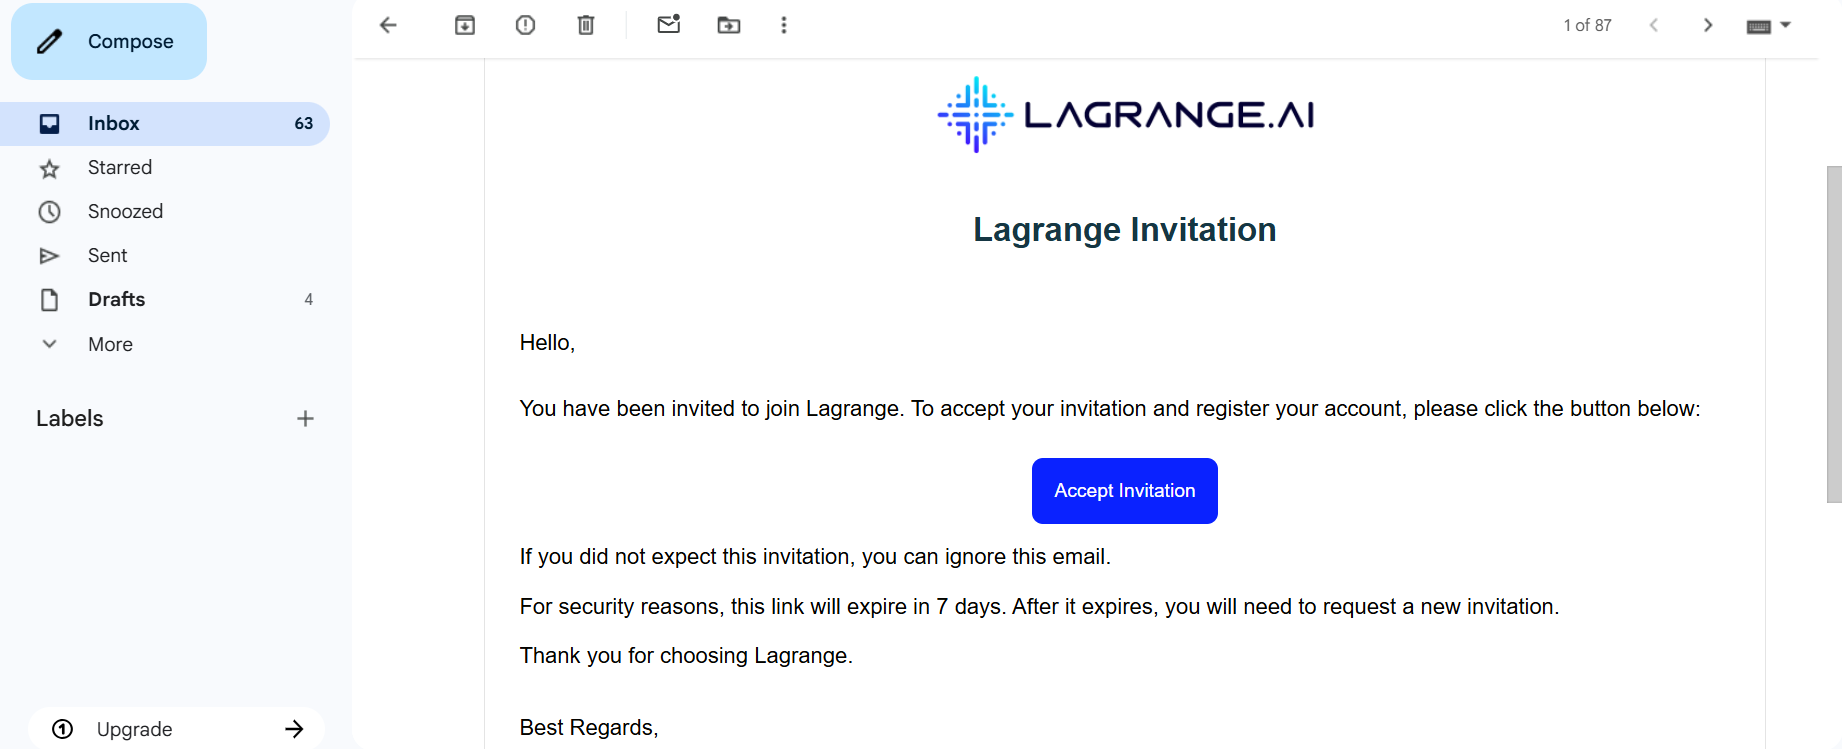
Accepting Organization Invitations
- Receive an email with an invitation link
- Click the link to open the acceptance page
- Verify your identity (create account or sign in)
- Join the organization with an assigned role
- Access granted → redirected to your workspace
Role-Based Access Control
User Roles & Permissions
- Full access to organization settings
- Manage users and workspaces
- Access subscription
- Configure policies
- View analytics and reports
- Access assigned workspaces
- Create and manage models
- View dashboards
- Manage personal settings only
How Roles Work
- Automatic Role Assignment (based on invitation or setup)
- Permission Enforcement (UI adapts to your role)
- Protected Routes (unauthorized users are redirected)
- Role Indicators (your role appears in settings)
Session Security Management
Auto-Lockout Timer
- System tracks your last activity
- After 15-30 mins idle, you'll get a warning
- If still idle → screen locks (password required)
- Longer inactivity → complete logout
Any mouse or keyboard activity keeps your session active
Session Persistence
Remember Me Feature
- Stay logged in between browser sessions
- Secure token stored locally
- Auto re-authentication on return
- Disable on shared devices
Multi-Device Support
- Sign in on multiple devices
- Each session tracked separately
- Security dashboard shows active sessions
- Remotely sign out from other devices
Base Model Management
The Model Analytics & Management system is the core engine of the Lagrange platform, enabling you to create, configure, and analyze supply chain models. This feature helps optimize your supply chain network through data-driven insights.
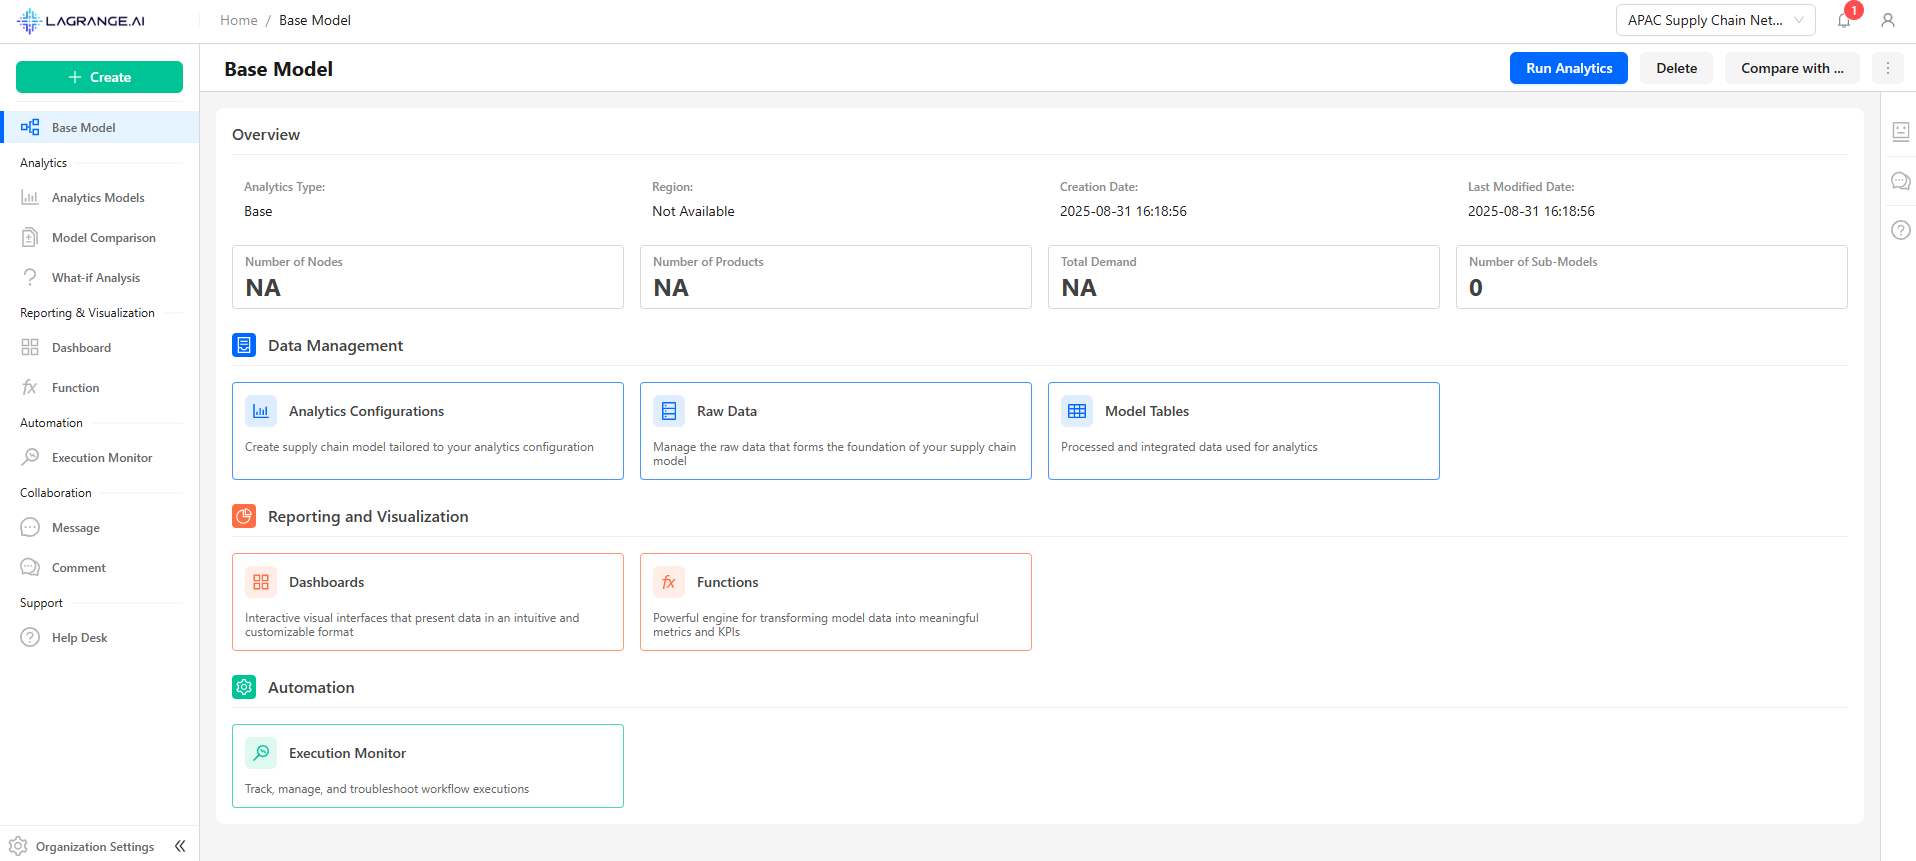
Location: Access via main navigation → Select workspace → 'Base Model' section
Base Model is the primary template and source of truth for all sub-models. Steps to View Base Model:
- Navigate to workspace homepage
- Click 'Base Model' in navigation
- View overview: Number of products, nodes, total demand, sub-model count
Analytics Configuration
Manage predefined analytics scenarios, reusable settings, and parameter sets.
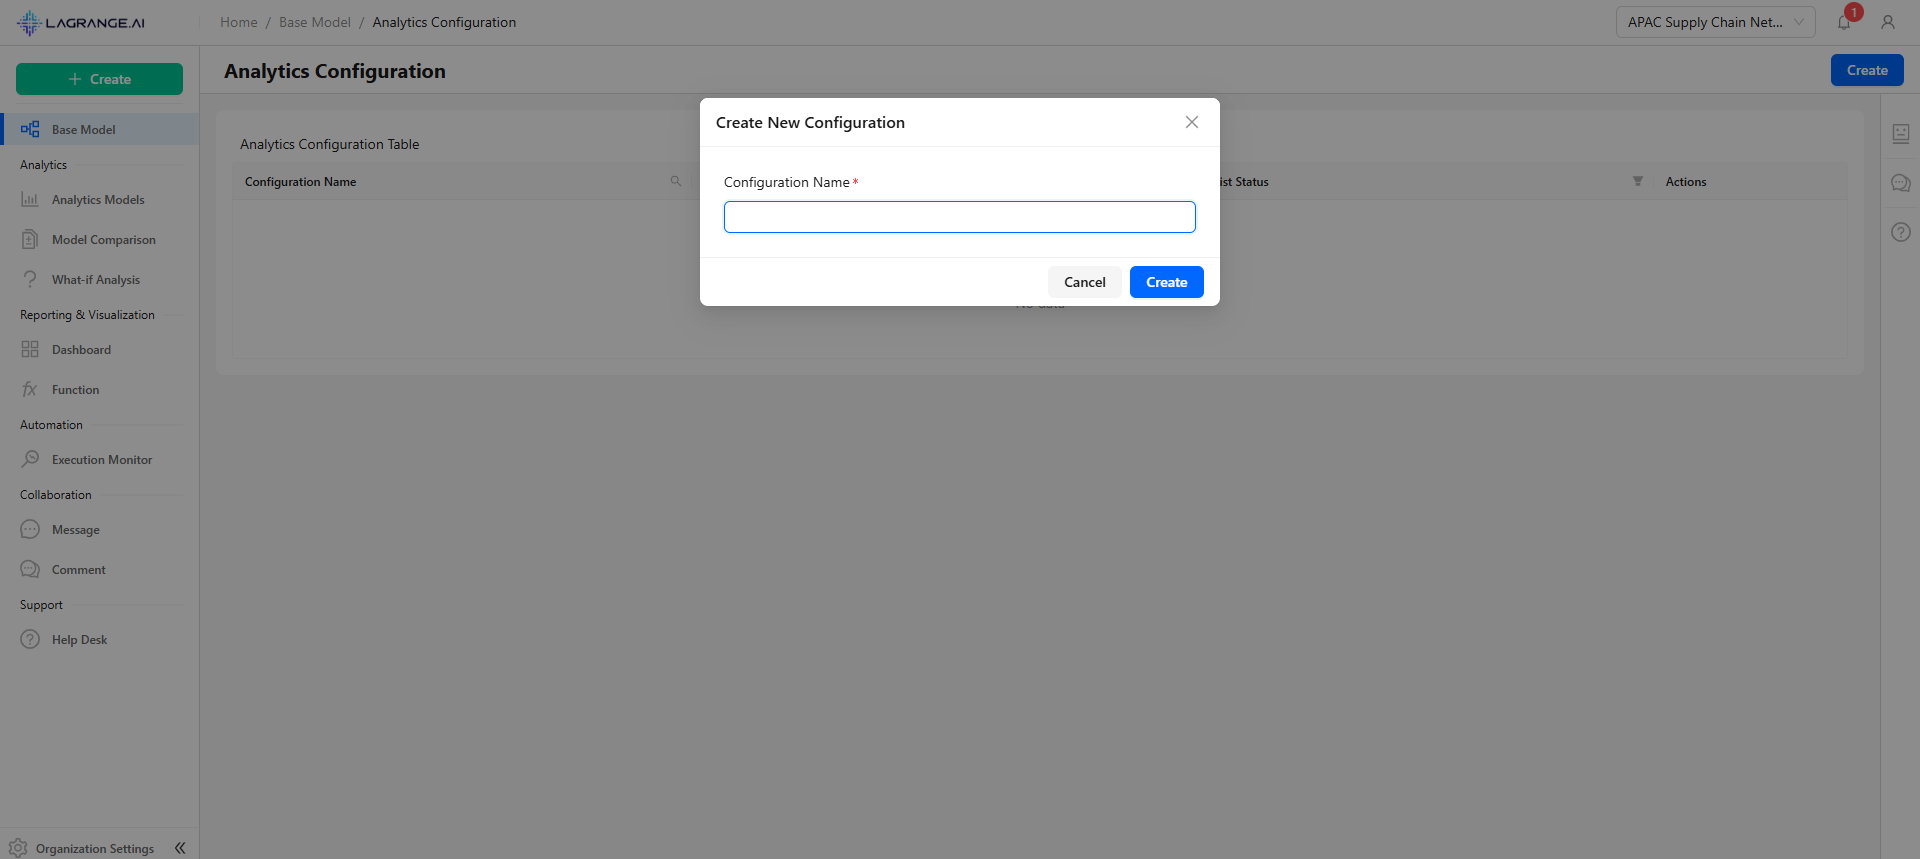
Name Your Configuration
Enter a descriptive name that clearly reflects the settings selected for this configuration, which will determine how analytics are run.
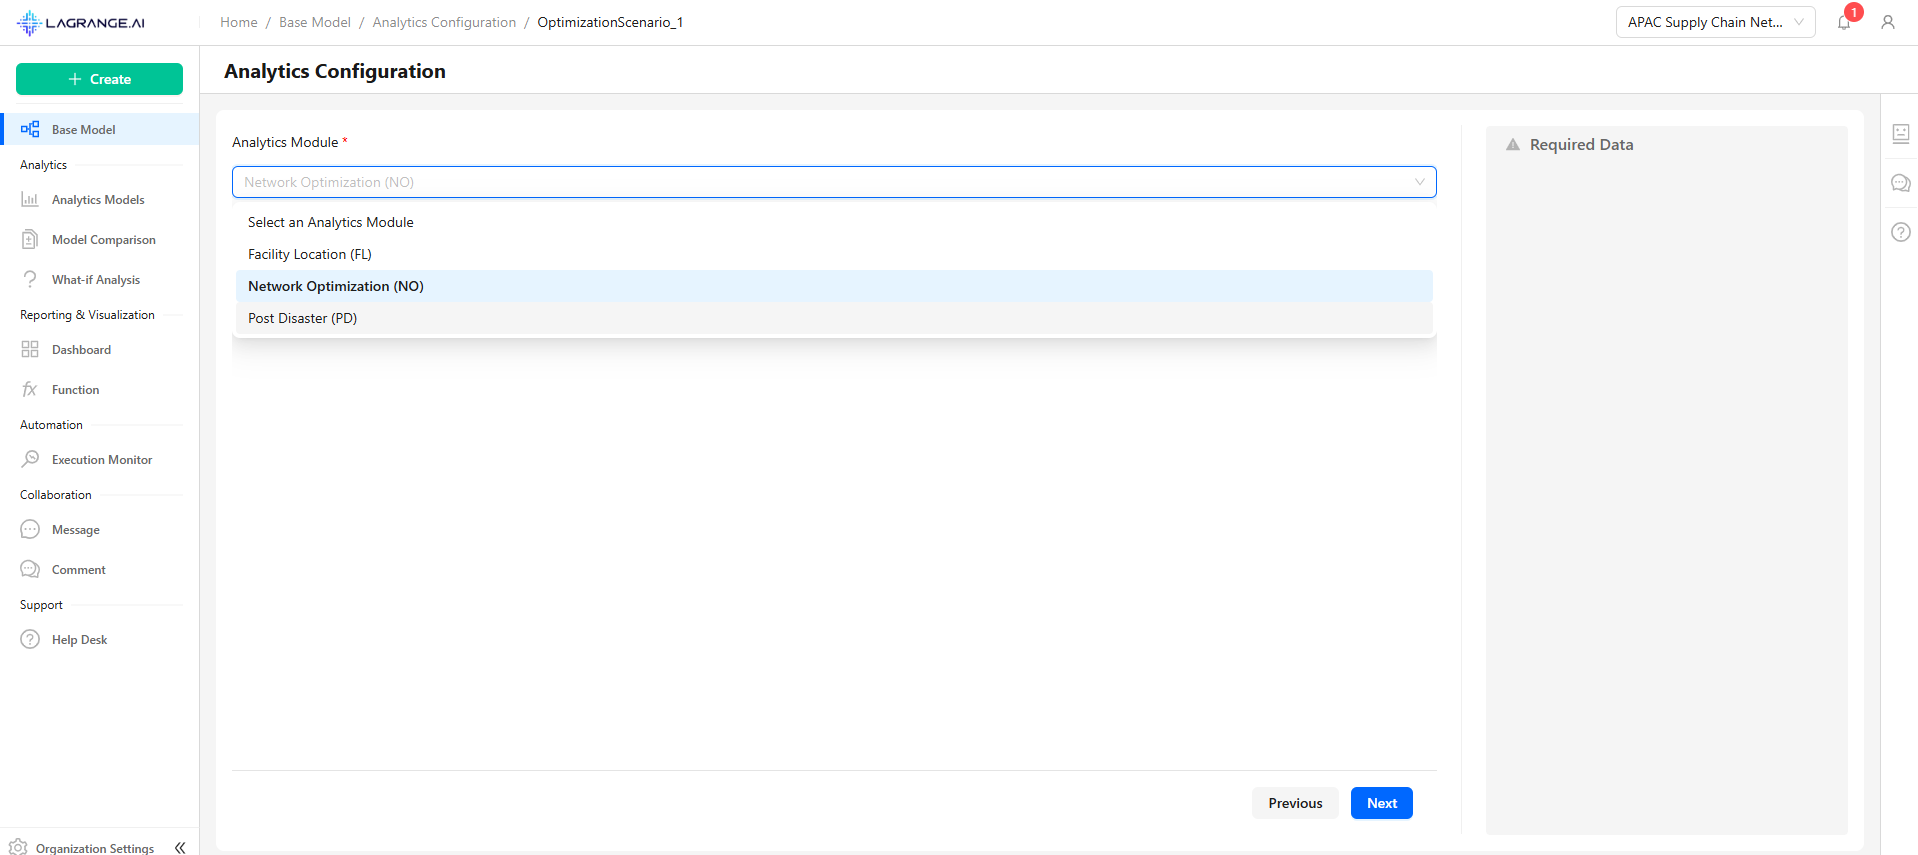
Select an Analytics Module
Choose one of the available analytics modules for this configuration. In this example, we select the Network Optimization Analytics to define which analysis will be executed.
Network Optimization
Network optimization focuses on finding the best structure for a supply chain or logistics network. The goal is to determine where flows should go and how much should be transported across the network in order to minimize cost.
Echelons in the Network
- Involves warehouses or distribution centers (DCs) and customers
- The problem is to decide how customer demand should be served from available DCs
- Includes factories, warehouses/DCs, and customers
- The model decides not only how to serve customers but also how products should flow from factories to warehouses
- Consists of suppliers, factories, warehouses/DCs, and customers
- A complete view where raw materials flow from suppliers to factories, are processed, then distributed to customers
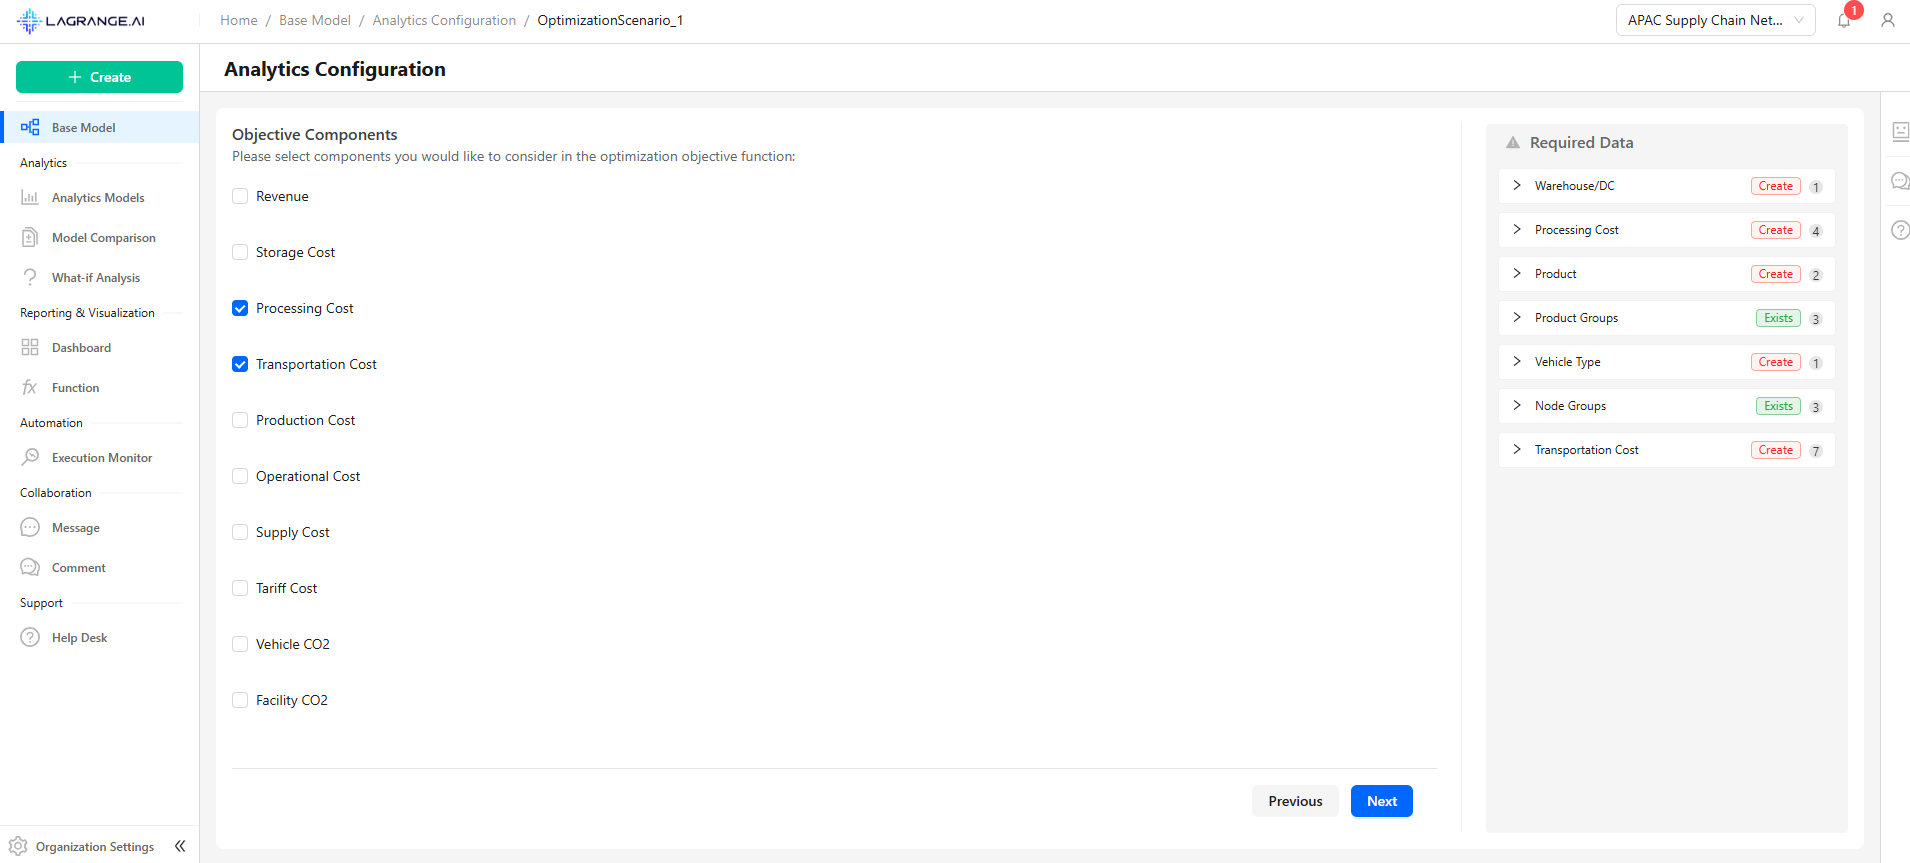
Objective Components
Select the key elements that should be included in the optimization objective function. These components will guide the analytics in evaluating and improving your supply chain network.
Distance Type
Choose how distances between locations should be calculated:
- Straight Distance: The direct "as-the-crow-flies" distance between two points
- Driving Distance: The actual road distance based on driving routes

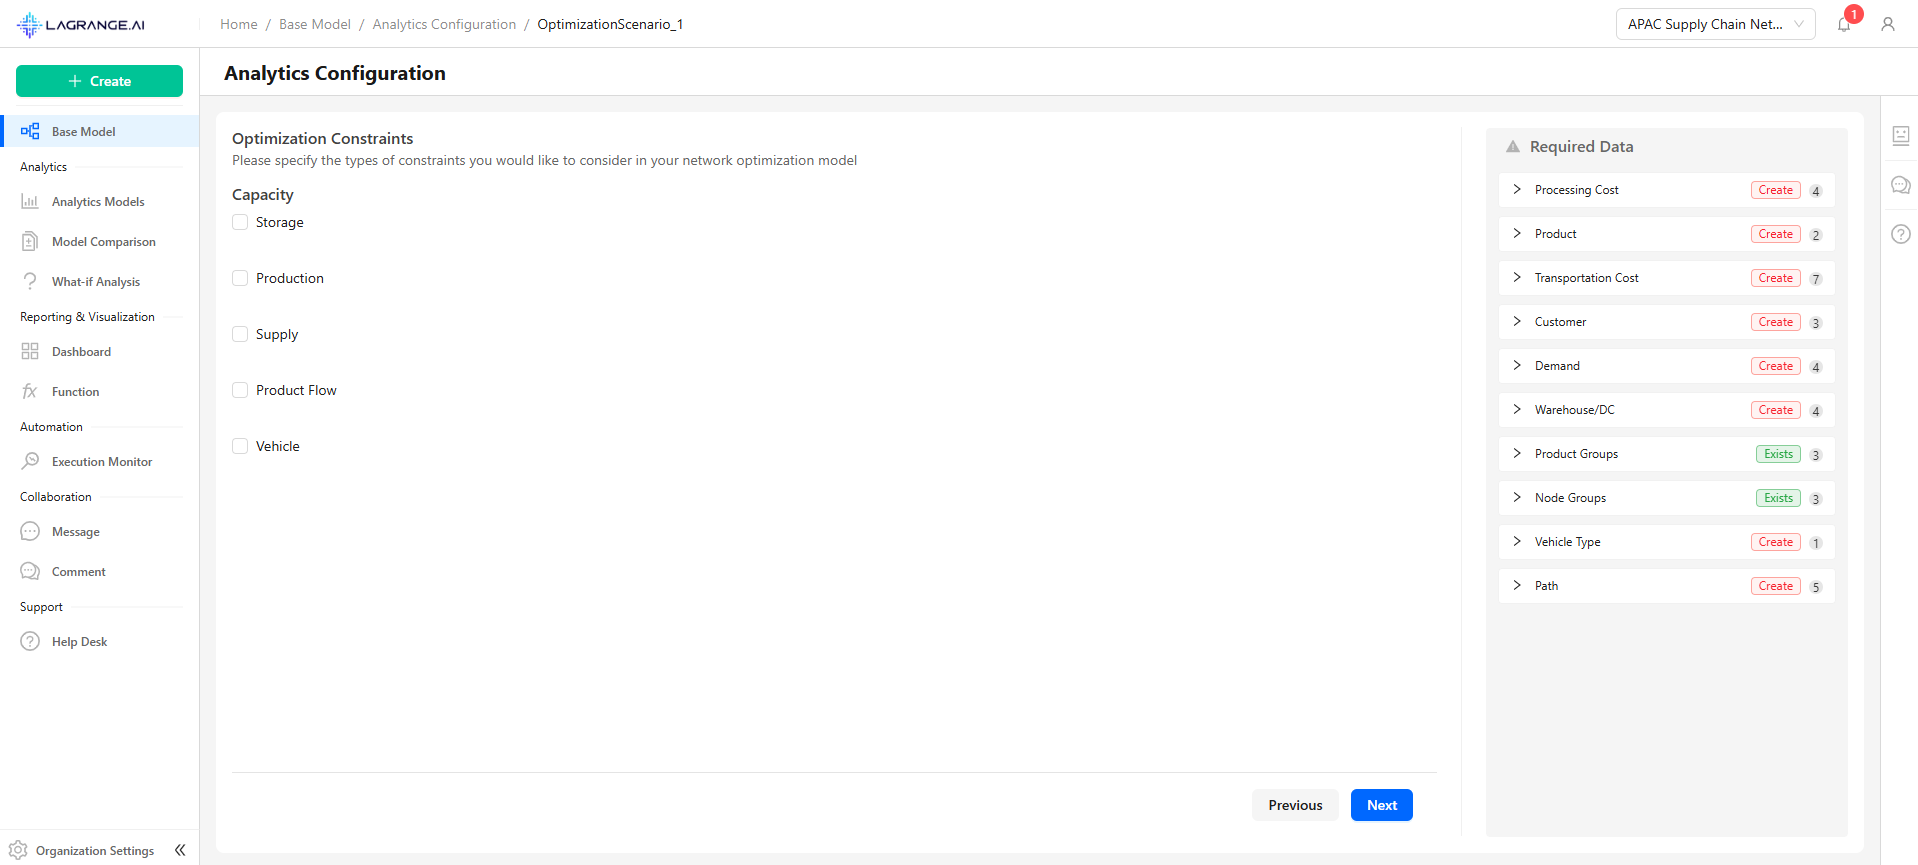
Optimization Constraints
Select the constraint types to include in your network optimization:
- Capacity
- Storage
- Production
- Supply
- Product Flow
- Vehicle
Data Management
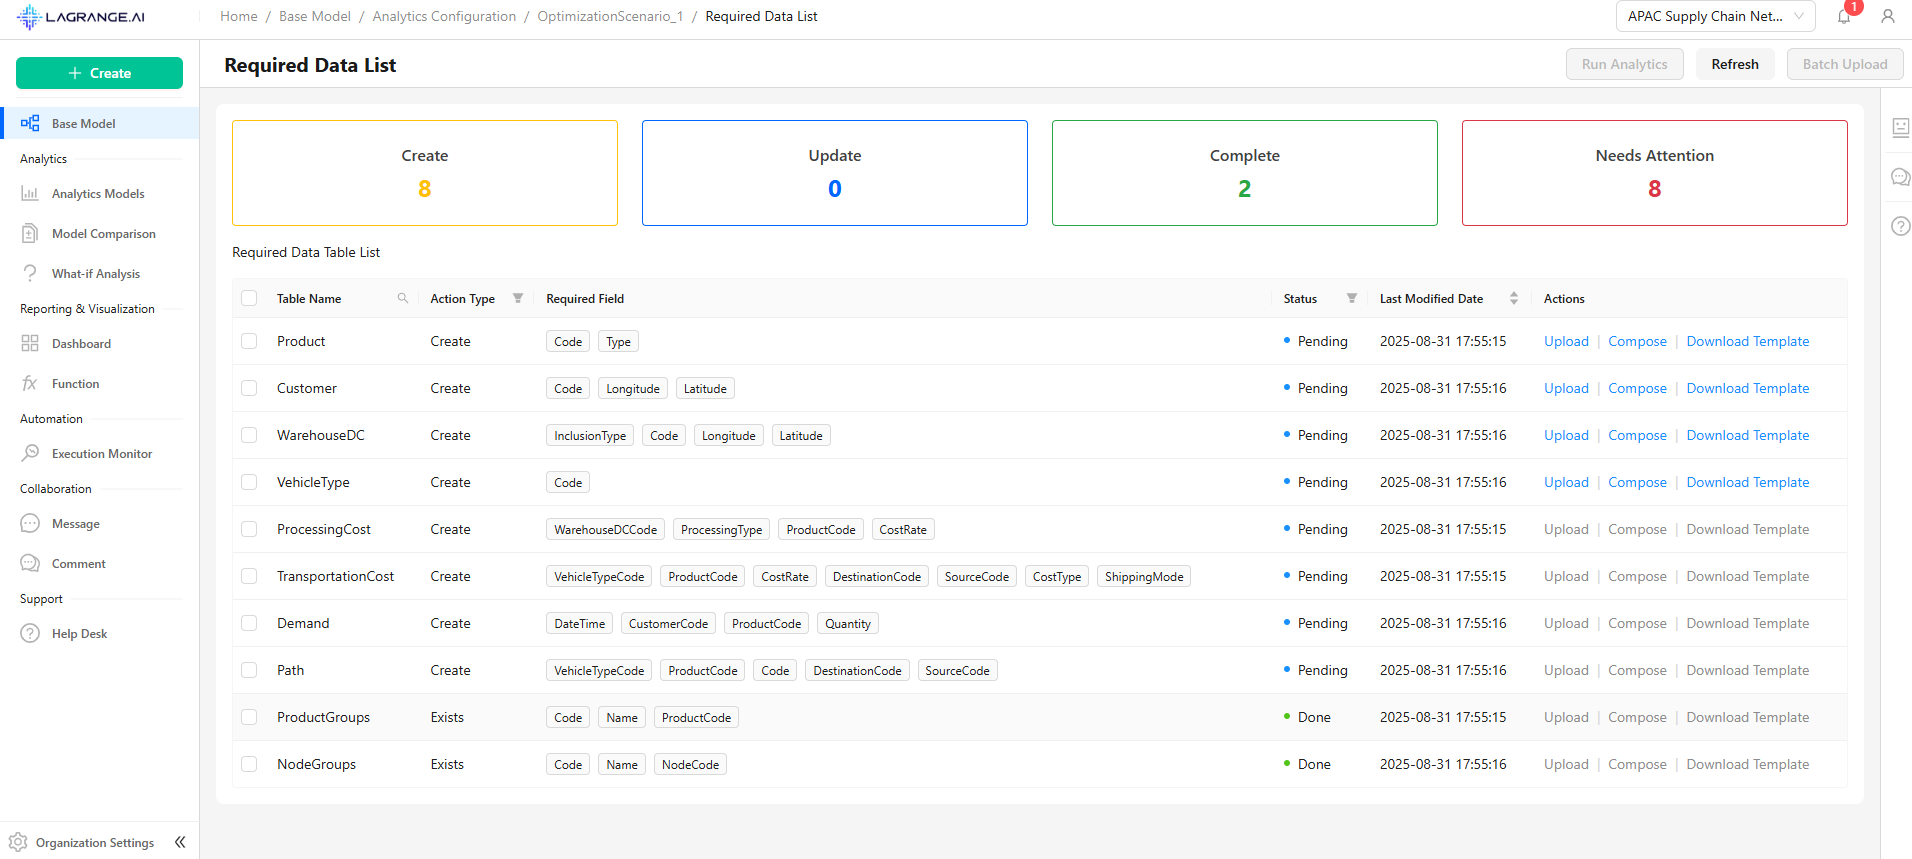
Required Data List
Clicking on a Required Data List opens the page where you can view all the tables needed for the selected analytics configuration. Each table shows the required fields, current status, last modified date, and available actions.
Data Preparation Process
For each table in your analytics configuration, the data preparation process is divided into several phases to ensure your datasets are accurate, complete, and ready for analytics:
Map source data fields to the corresponding model table fields. Only the required fields need to be labeled.
- Use the same field - Directly map the source column
- Use another field - Select a different column
- No Labeling - Skip optional fields
- Ignore - Exclude fields not needed
Check the mapped data for correctness and completeness. The system checks each field for:
- Missing values
- Incorrect types
- Invalid formats
- Constraint violations
Ensure that the dataset complies with business rules and maintains integrity across multiple fields and external references.
- External Reference Consistency
- Cross-Field Validation
- Business Rule Validation
Review overall status, identify issues, and confirm readiness for analytics. Key metrics include:
- Completeness Metrics
- Validity Metrics
- Accuracy Metrics
- Consistency Metrics
Upload Options
Batch Upload
You can select multiple tables at once and use the Batch Upload option at the top of the page to upload all selected datasets together.
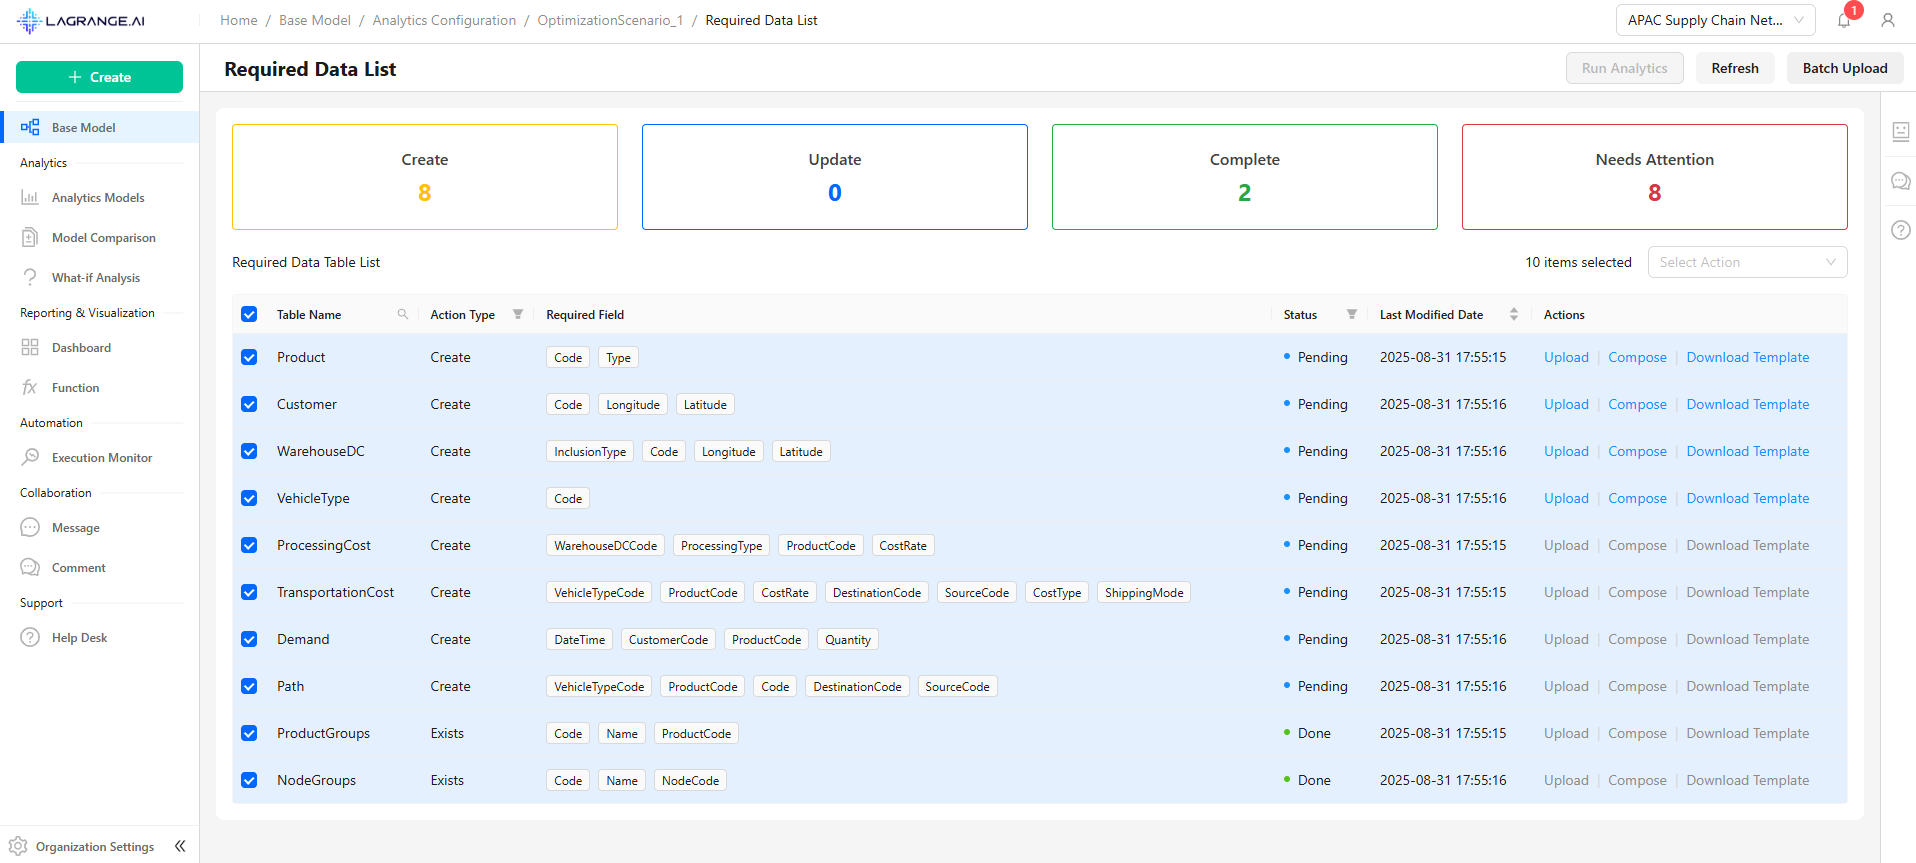
- Overwrite Existing Data: Replace any previous data with the new upload
- Insert Rows at the End (Append): Add the new data to the end of the existing data
Execution & Monitoring
This page provides a real-time overview of your analytics execution.
Execution Summary
- Name: The scenario name (e.g., OptimizationScenario_1)
- Type: Type of process (analytic)
- Status: Current execution status (running, completed, or failed)
- Start Time: When the analytics run began
- Duration: Elapsed time since the run started
- Submitted By: User who initiated the run
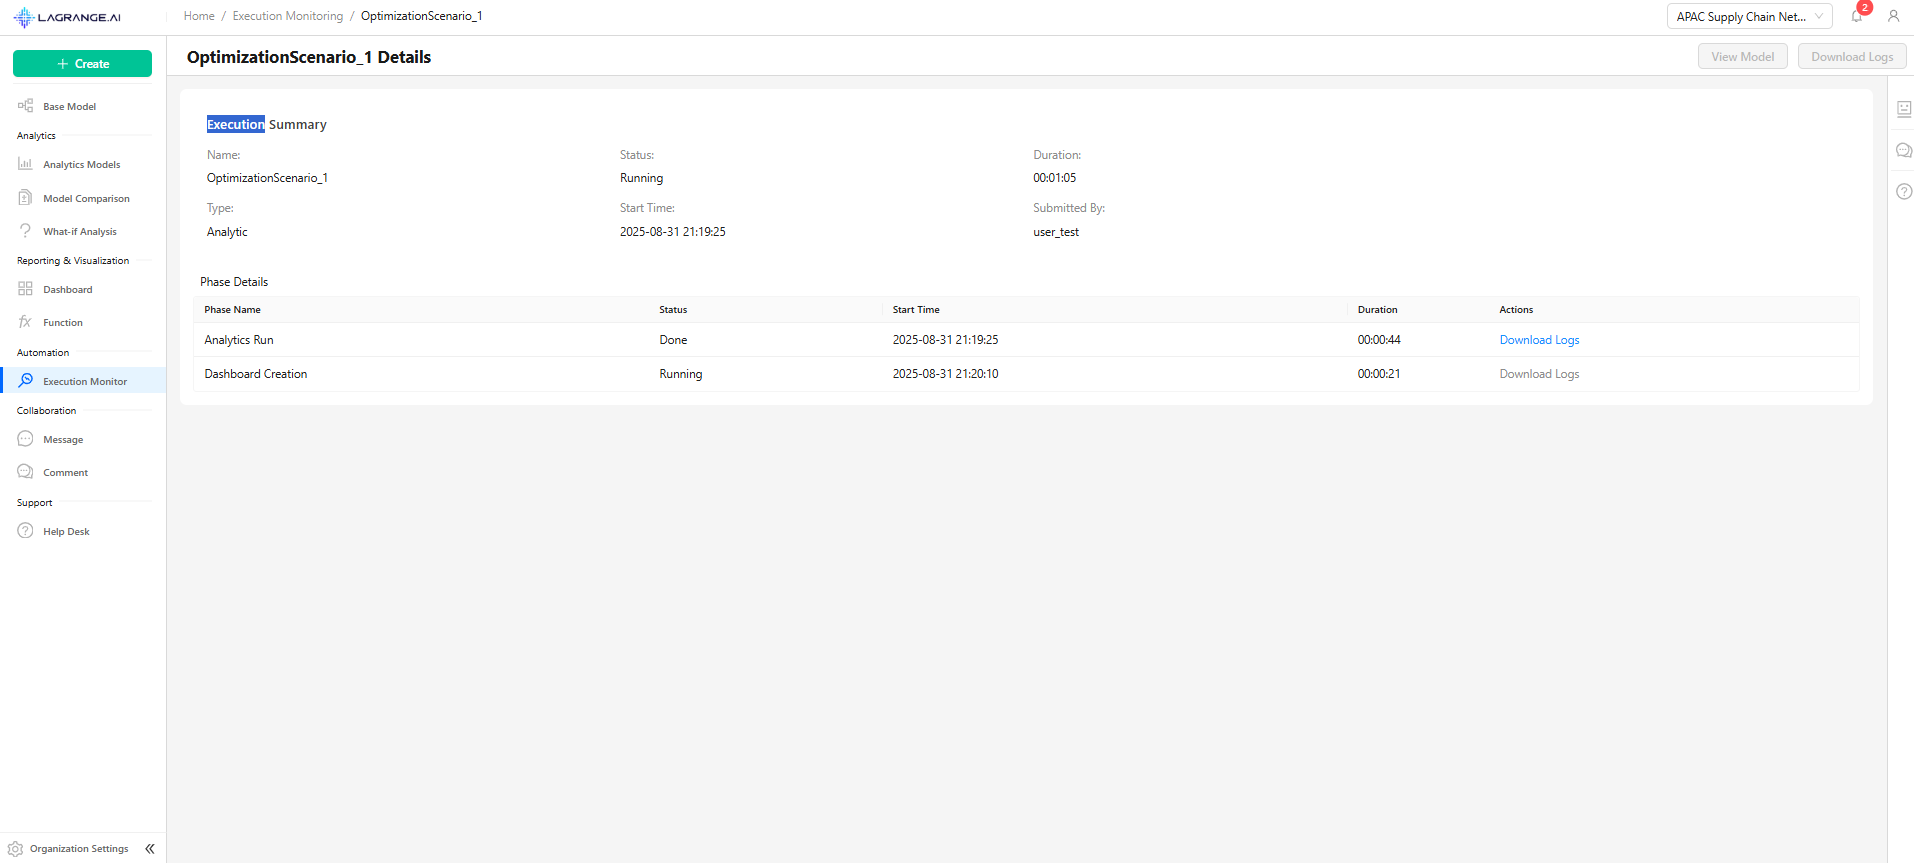
Phase Details
Each analytics run consists of multiple phases. For each phase, you can view:
- Phase Name: Name of the phase (e.g., Analytics Run, Dashboard Creation)
- Status: Current status of the phase
- Start Time: Phase start time
- Duration: Time elapsed for the phase
- Actions: Options such as Download Logs to review phase details
From the top of the page, you can download logs for the entire run and view models that have been generated by the analytics run.
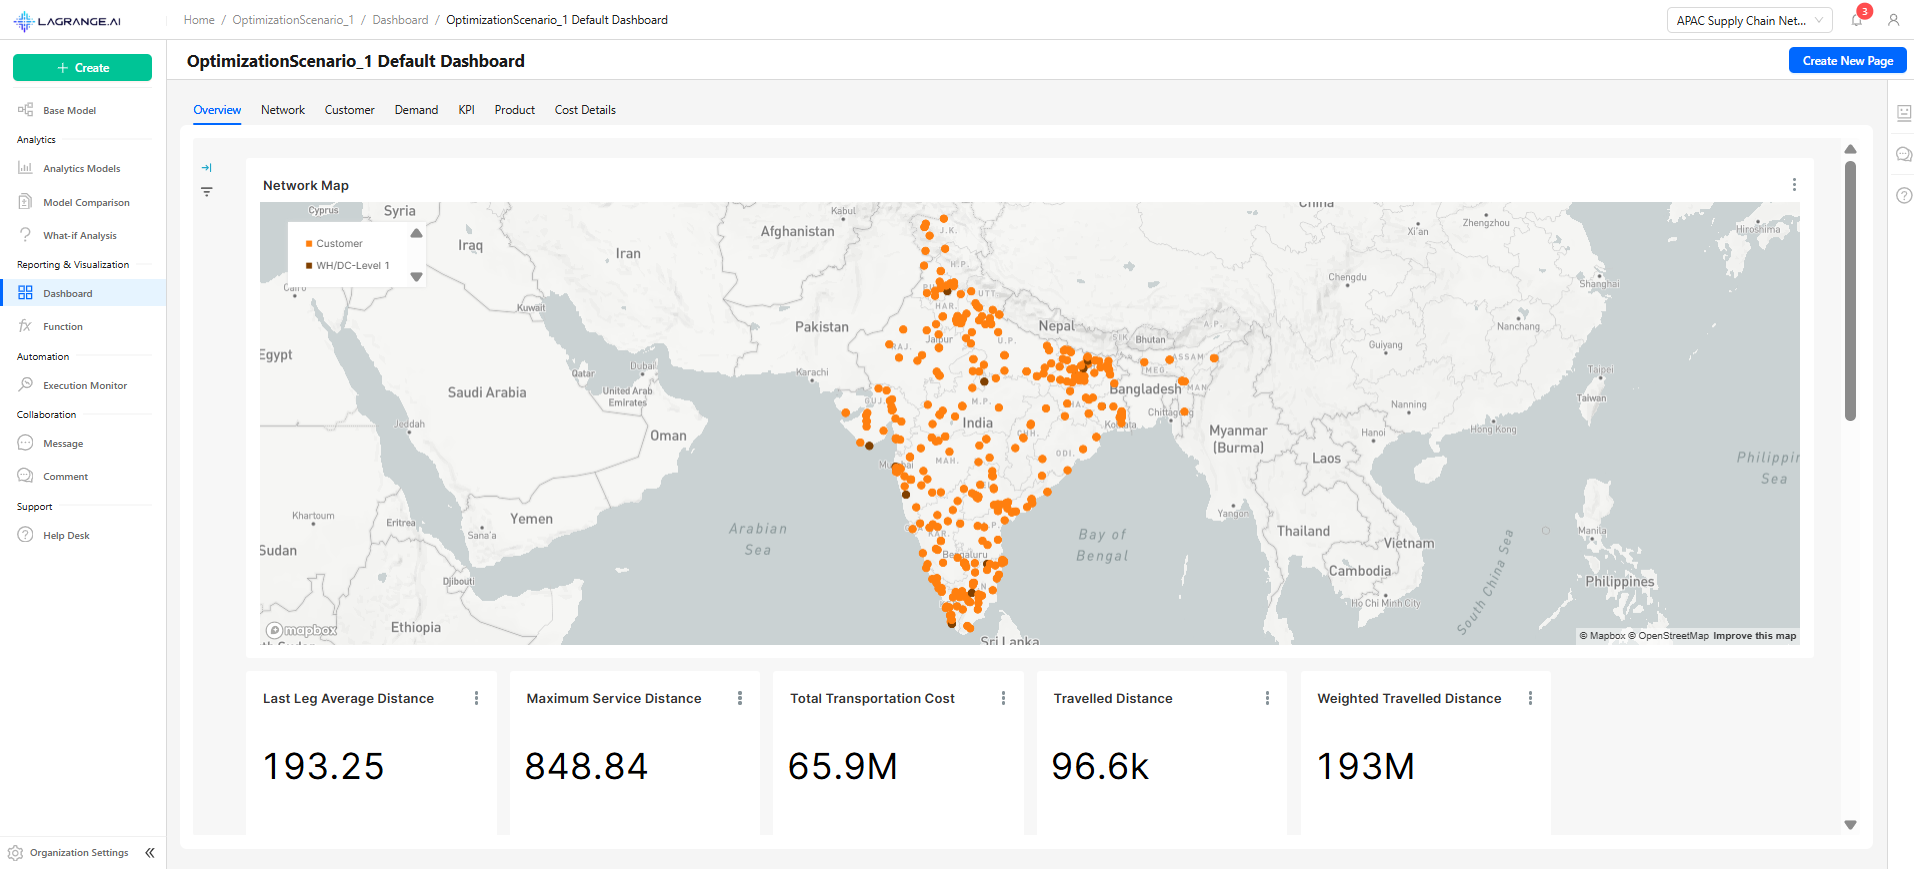
Dashboards
You can access the dashboard for a created model in two ways:
- From the Execution Details: After running a model, click View Model to navigate to the model's page
- From the Base Model Dashboards: Navigate to the Dashboards section of the Base Model
Dashboard Structure
- Each dashboard can contain multiple pages
- Each page may include several charts, providing a comprehensive view of analytics and performance metrics
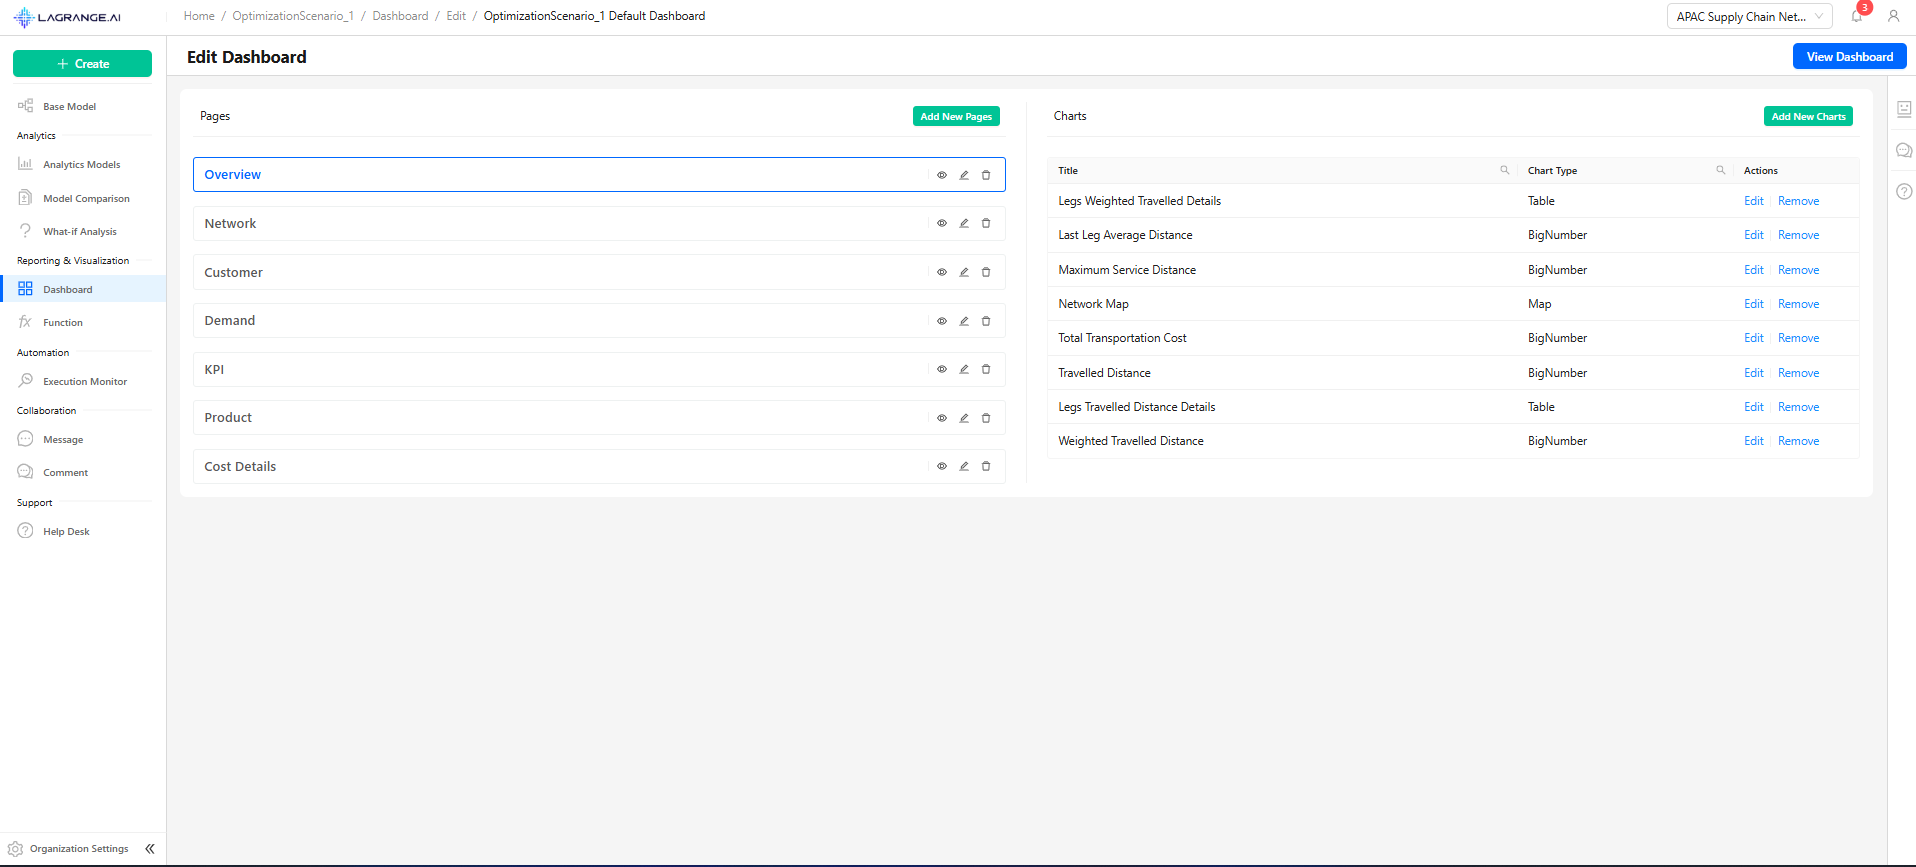
Dashboard Editing
This page allows users to modify existing dashboards, manage pages, and configure charts.
Page Management (Left Panel)
- Displays all pages in the dashboard
- Select Page: Click a page to view or edit its charts
- Add New Page: Button to create additional pages
- Reorder Pages: Drag and drop pages to change their sequence
Chart Management (Right Panel)
- Shows all charts associated with the selected page
- Add New Chart: Button enabled only when a page is selected
- Edit Chart: Modify chart properties
- Remove Chart: Deletes chart from the page
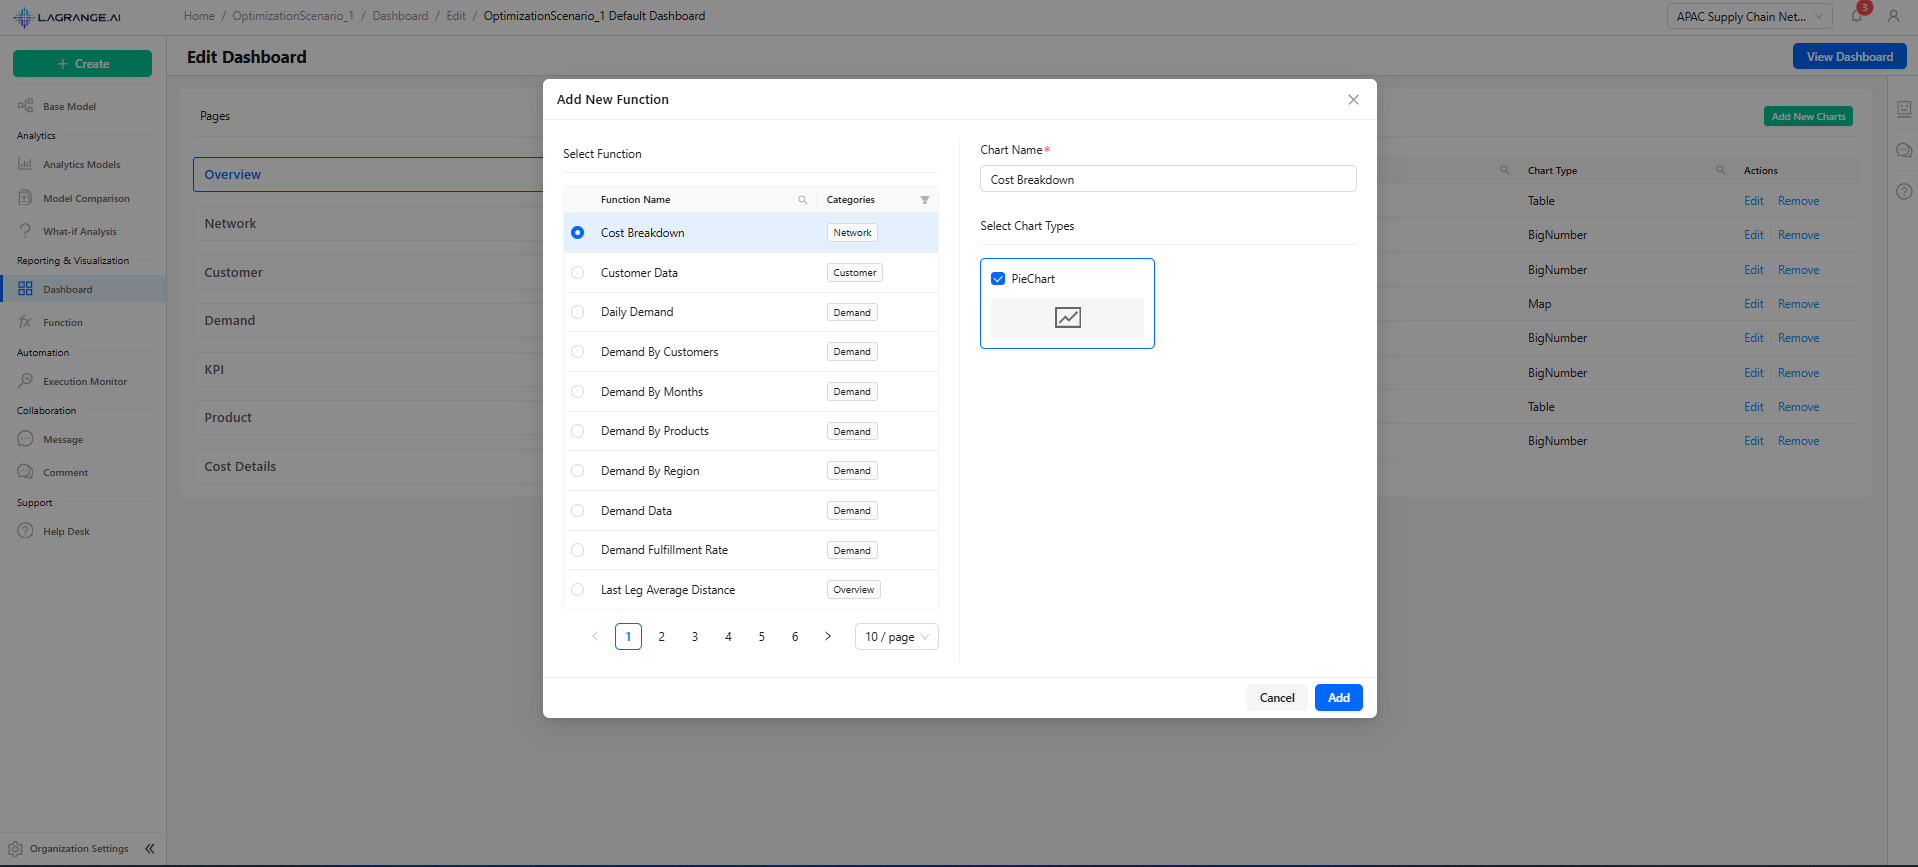
Adding New Charts
The modal allows users to add charts to a selected dashboard page:
- Displays a searchable and filterable table of available functions
- Users can select a single function to create a chart
- Filter and search options are available
- Chart Name: Auto-populated based on the selected function
- Select Chart Types: Bar, Line, Pie, Table, Area, Tree, Funnel, Heatmap
- Multiple chart types can be selected for the same function
Workspace Management Overview
Multi-tenant workspace system enabling organized supply chain analytics with visual workspace identification, quick access features, and comprehensive organization management.
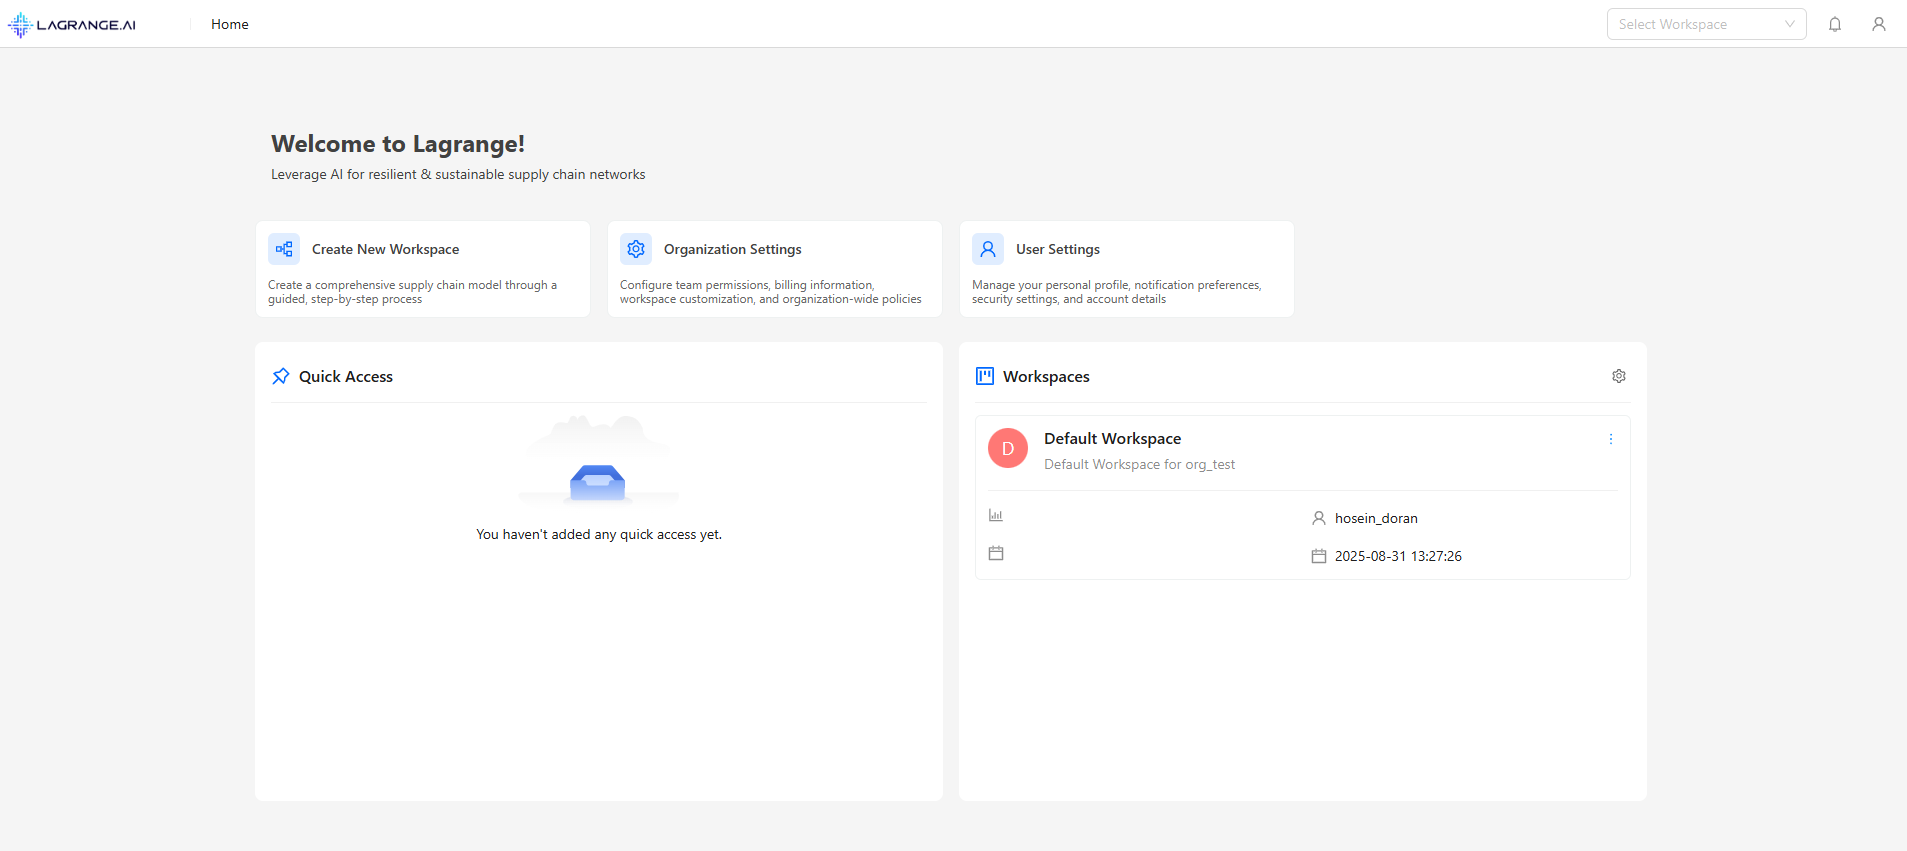
Welcome Interface
Key Components:
- Organization Settings (Admin only) - policies
- User Settings - Profile, notifications, security
- Create Workspace
- Quick Access
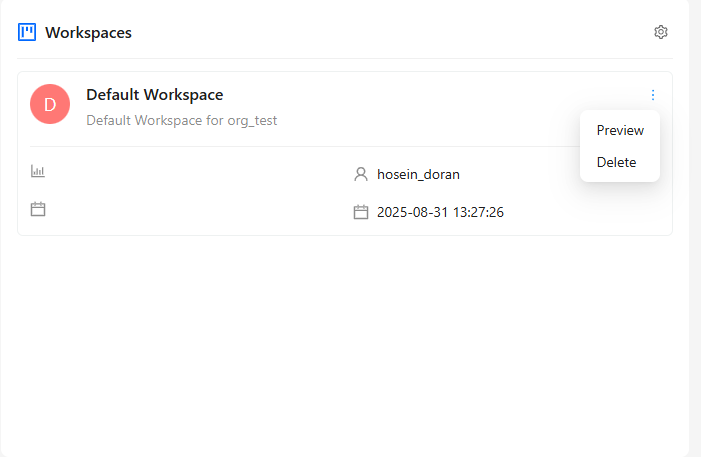
Workspace Display
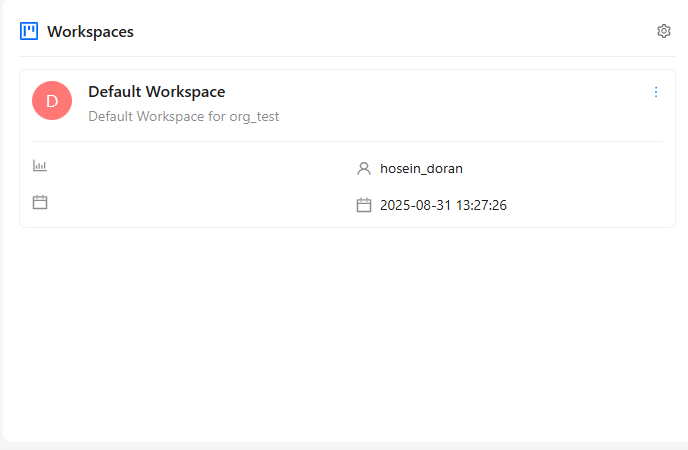
Workspace Actions
Dropdown Menu: Preview, Delete (confirmation required)
Click Actions: Single click to navigate to workspace and set it as active
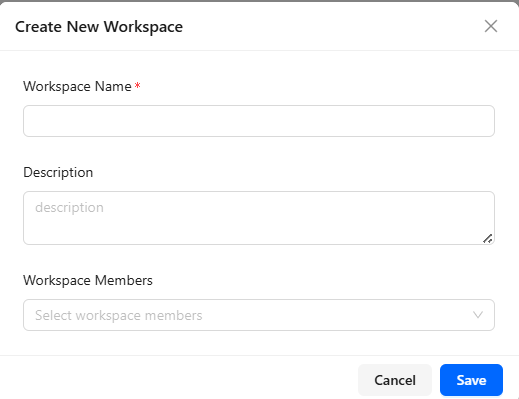
Workspace Creation
Required Fields
- Workspace Title: Unique, descriptive name
- Description (Optional): Purpose and scope, key objectives
- Workspace Members: Multi-select from organization users
Creation Process
- Open modal
- Fill information
- Submit & Confirm
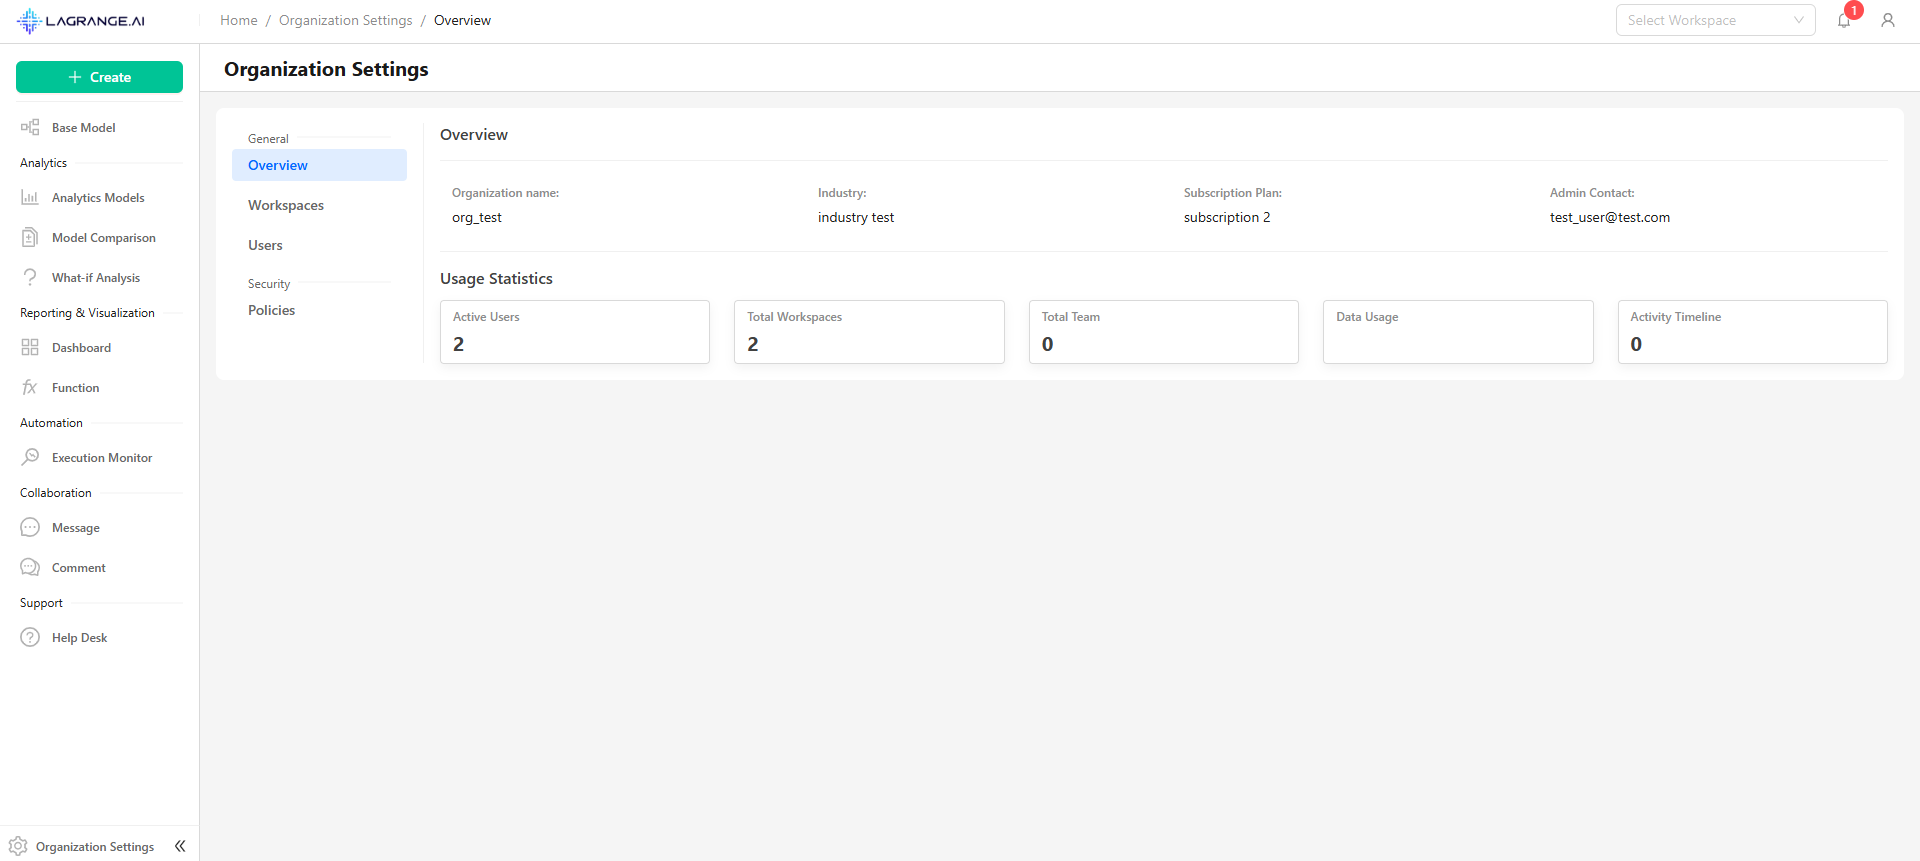
Organization Settings
Includes the following features:
- Overview: High-level summary of your organization's activity and key metrics
- Workspaces: Manage, create, and configure all organizational workspaces
- Users: Add, remove, and manage user roles and permissions
- Policies: Define and enforce organization-wide rules and security settings
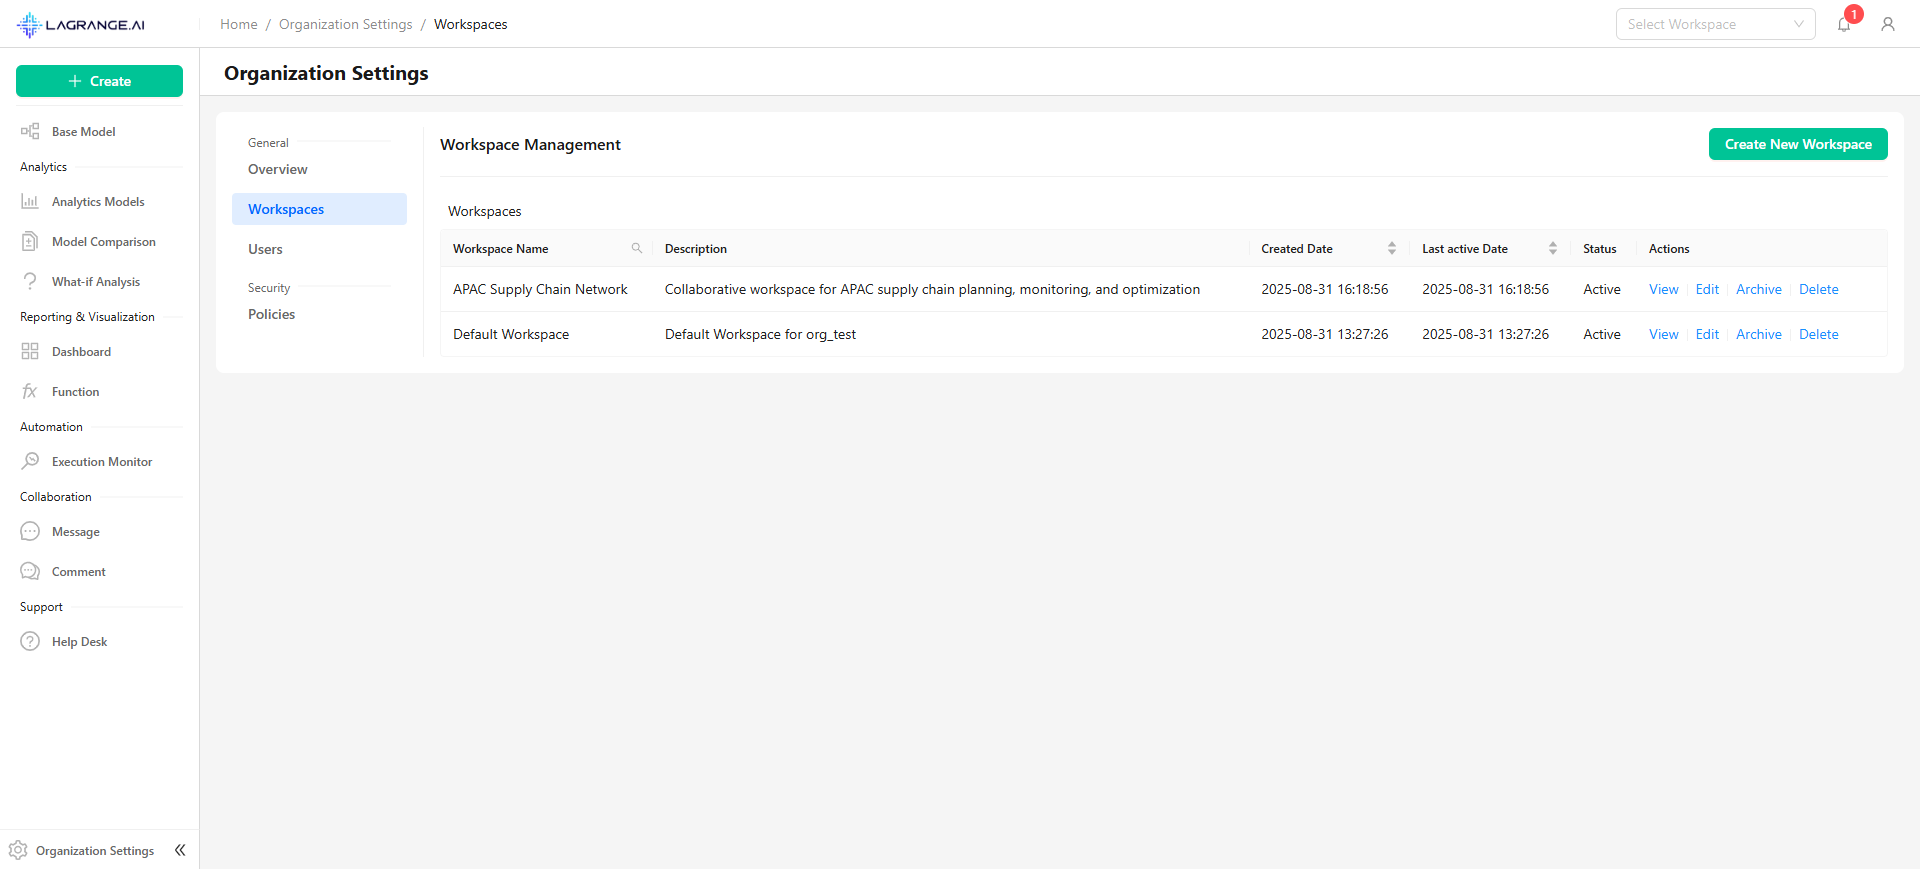
Workspace Management Table
The Management Table includes title, description, created by, date, last modified, and actions.
Administrative Actions: Edit workspace, Delete workspace.
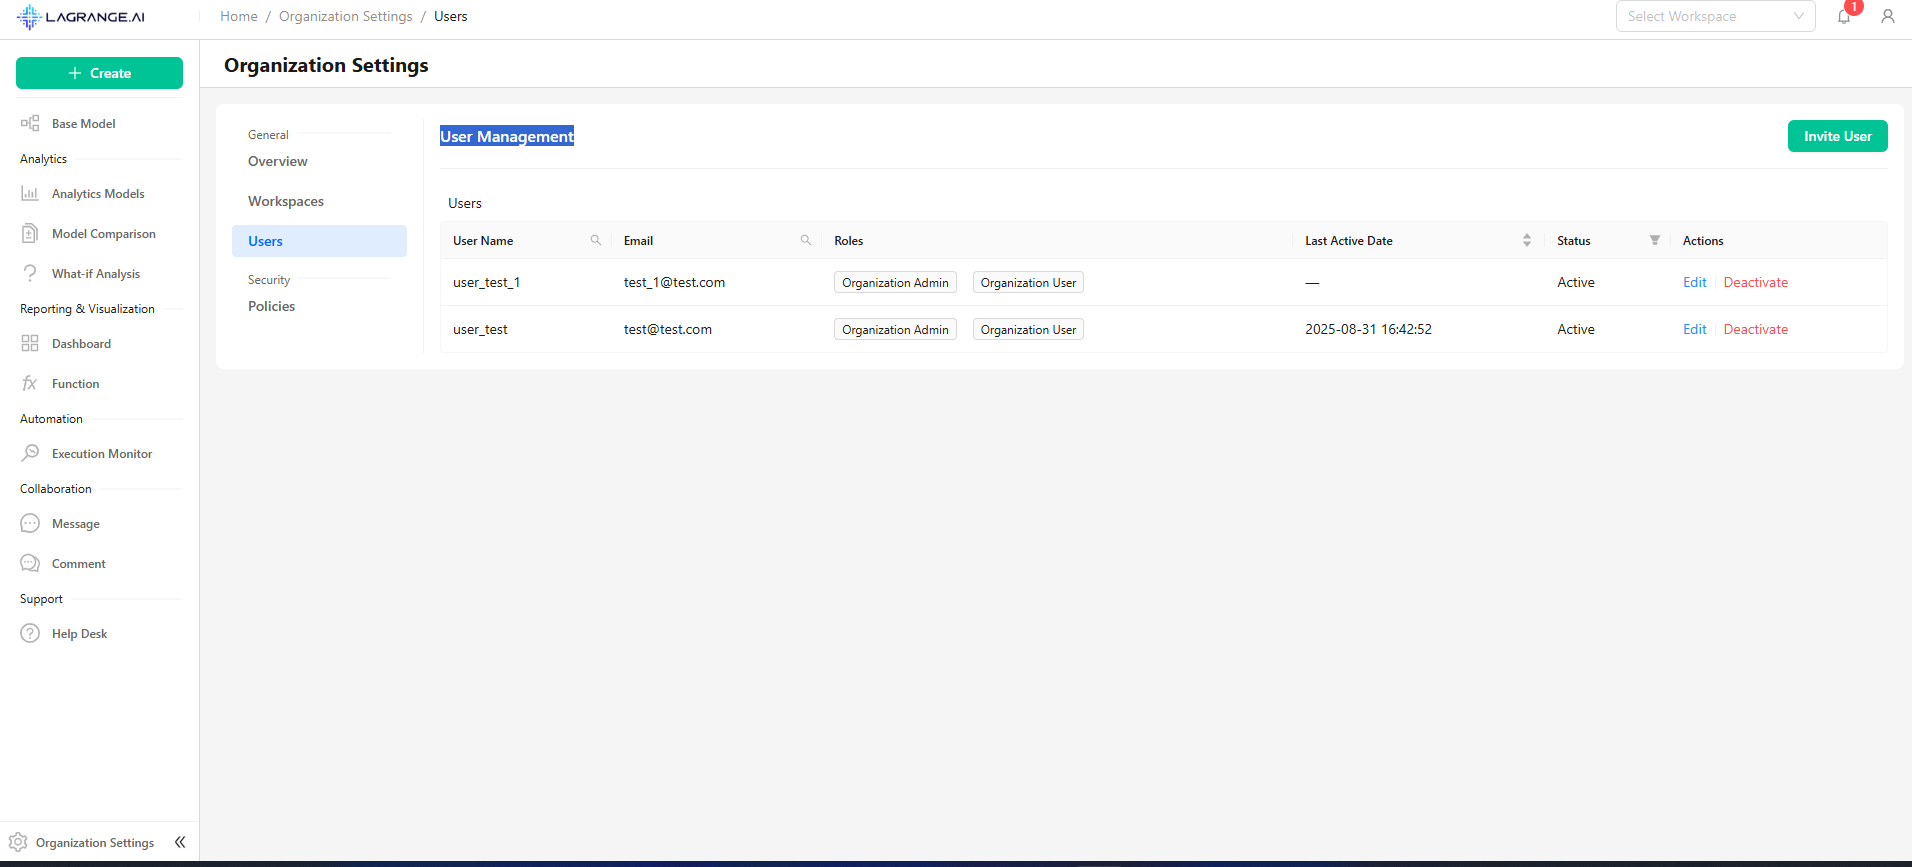
User Management
Displays user information and roles within the organization, with options to edit, activate, or deactivate users.
Common Workflows
Creating New Workspace
Navigate to Management → Create Workspace → Configure Workspace → Invite Team
Accessing Workspace
From Home Page or Quick Access → Select workspace → Auto-navigates to base model
Managing Members
Add Members: Edit workspace → Select users → Assign roles → Save changes
Remove Members: Edit workspace → Deselect users → Confirm removal → Update permissions
- Cannot create workspace → Check plan limits or permissions
- Duplicate name error → Use unique workspace name
- Members not appearing → Verify organization membership
- Delete confirmation fails → Type exact workspace name
- Color not displaying → Refresh page or clear cache
- Quick access empty → Start using workspaces to populate